200 million monthly downloads
24 million monthly readers
3 million authors submit annually

200 million monthly downloads
24 million monthly readers
3 million authors submit annually

Collection
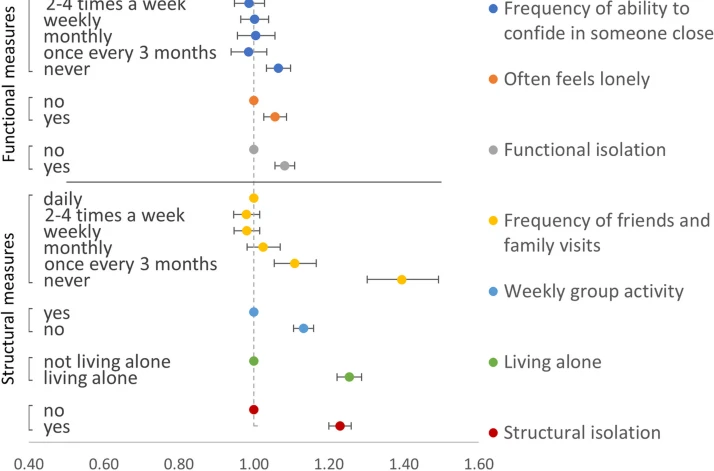
The world’s population is ageing, and with ageing comes an increased risk of disability, multimorbidity and dementia, and an increased need for support. Older people are motivated to stay in their own homes as they age as an alternative to intramural care that is cost-beneficial and often provides...
Collection
An urban community is an intricate network connected by a myriad of functional systems and subsystems, including civil structures, underground spaces, multi-modal transportation, telecom, energy grids, retail facilities, food systems, and healthcare facilities, all operating with unique spatial and...
Collection
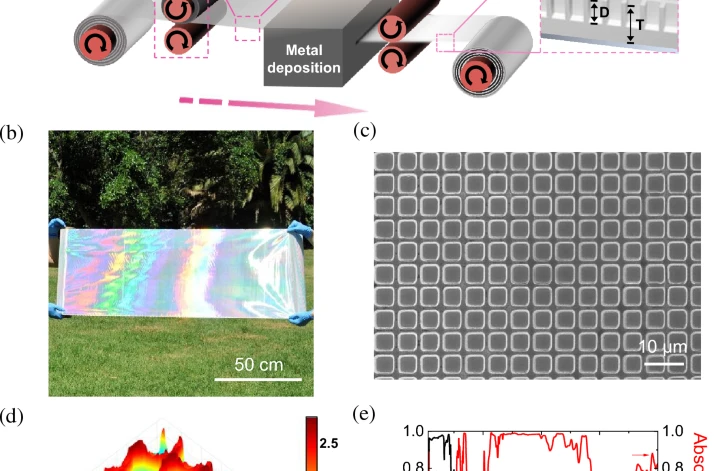
To address the detrimental effects of climate change, innovative and timely approaches in renewable energy and environmental chemistry are essential. Photocatalytic conversion of carbon dioxide has garnered significant attention as a viable method for carbon capture and utilization, offering the...
SN Applied Sciences is now Discover Applied Sciences! We are excited to announce that SN Applied Sciences moved into our fully OA Discover journal...
Discover Sustainability is an open access journal publishing research across all fields relevant to sustainability. Average number of article...
The Journal of Epidemiology and Global Healthis an international peer reviewed journal which aims to impact global epidemiology and international...


As part of Springer Nature, SpringerLink delivers fast access to the depth and breadth of our online collection of journals, eBooks, reference works and protocols across a vast range of subject disciplines.
SpringerLink is the reading platform of choice for hundreds of thousands of researchers worldwide. Find out how to publish your research with Springer Nature.